top of page

FELIPE TEODORO

Senior Data Analyst
PL-300, AZ-900 & DP-900

E-mail:

Contact:

+55 34 9 9206-8852

Brasília - DF (Brazil)

Location:

whatsapp.png

Social Media:

gmail.png
linkedin.png
github.png

Hello, my name is Felipe, Civil Engineering since 2017, Data Analyst since 2020 and now a graduated Data Scientist (2024).
This portfolio is designed to showcase my career journey. Feel free to explore it!

WhatsApp Image 2025-01-22 at 17.02.49.jpeg
Captura de tela 2024-11-14 174911.jpg
images.jpeg
block_2385-imgdp900microsoft-azure-data-fundamentals-350x350.png

PORTFOLIO

data-science_8649621.png

Repository containing scripts and algorithms of Machine Learning, using the library "Scikit-Learn" to develop models of Linear and Polynomial Regression, KMeans and Statistics.

connections.png

This repository has a code that allows a connection between Python and MySQL. Python was used to do the ETL on the data, and once the it was ready, I used the libraries "sqlachemy" and "MySQLdb", to export data into the database on MySQL.

project.png

Personal project, used on my graduation final report. This one is basically doing all the ETL necessary (nothing left for Power Query), and also creating the dimension tables, and exporting it all to MySQL.

automation.png

Algorithm containg an automation code, using the library "selenium". It access the website Kaggle, and put all the necessary information to get a link and download a ".csv" file. The intention of this was to automate the process of updating the data to work with it

Captura de tela 2025-02-18 100916.jpg

This is an example of an application of the KMeans algorithm applied to a real life situation, and a few solutions that are possible through it.

POWER BI REPORTS
Dash1.jpg

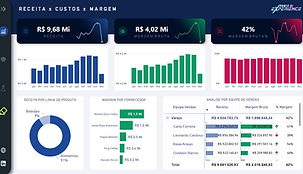
Revenue x Costs x Margin

The report allows control over spending, revenue, and margin. Control is also divided by date, production line, sales team, and supplier. This is crucial for maintaining oversight of areas that need more attention and understanding where most of the revenue is coming from. Another useful tool in this report is the "What If" simulator, which allows you to project how much needs to be spent to achieve a specified profit.
Dash2.jpg

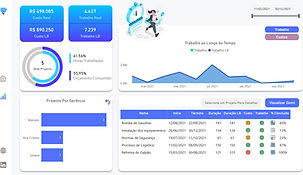
Project Management

The dashboard offers a detailed view of project costs, essential project details and task criticality. A task management table shows each task's period and status—whether overdue, completed, or in progress. This tool is crucial for maintaining project oversight, helping the team prioritize critical tasks and monitor progress. By visualizing these elements, the dashboard supports timely project completion and effective resource allocation to meet business goals.
financial dashboard.PNG

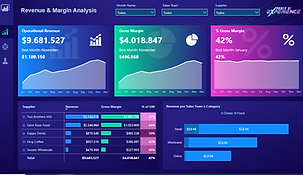
Statements of Operations

This sales dashboard provides a detailed view of revenue and expenses, presented through an income statement, which helps in tracking profitability and financial performance. Additionally, it includes a "What If" simulator, allowing for projections of spending required to achieve specific profit targets. This tool is invaluable for guiding strategic decisions, as it helps identify revenue sources, control costs, and forecast outcomes.
Dash3.jpg

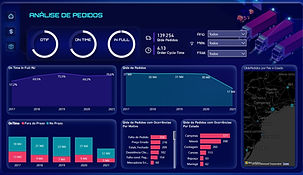
Logistics Report

A logistics dashboard that offers insights into branch performance, vehicle costs, revenue vs. expenses, and order status. Key metrics include On Time In Full (OTIF), On Time or In Full, and order issues by reason and state. This tool is crucial for monitoring efficiency and identifying cost-saving opportunities, ensuring timely deliveries and improved customer satisfaction across locations.

Dash4.jpg

Transportation Federal Admistration Report

This report controls the numbers, results and situation of a program from Brazilian federal government, which controls the number of Stopping and Rest Points for truckers drivers in the country. This program offers better conditions for the drivers, in several points, most of them being gas stations, to have a decent and safe place to stop during their trips, take a bath, eat something and continue their trips afterwards.

PROFESSIONAL EXPERIENCES

Personal Projects

From 09/2024 to present

Data Scientist

Polly

Data Analyst and Investor Specialist

From 08/2024 to present

Sicoob Bank

Data Analyst

From 01/2022 to 08/2024

DataClimb

From 01/2021 to 12/2021

BI Consultant

Department of Transportation Infrastructure

Data Analyst and Technical Admistrative Assistant

From 01/2021 to 12/2021

NAQUINZE Bar and Tattoo Studio

From 10/2020 to 12/2020

BI Consultant

SKILLS

Finances

Notable experience in analyzing business data such as profitability, revenue, financial forecasts, market movements, economic projections, direct and indirect expenses, among other information.

SQL and NoSQL

Advanced knowledge in SQL and NoSQL databases, including SQL Server, and MySQL and MongoDB, with solid experience in complex queries, normalization, and performance optimization.

Power BI

Microsoft-certified professional in Power BI (PL-300), with proven ability to develop interactive dashboards and detailed reports. Experienced in connecting, transforming, and modeling complex data.

Python

Skilled in data analysis with Python, using libraries such as Pandas, Matplotlib, Seaborn, Numpy, Selenium, and Plotly.

Machine Learning

Experienced in data science and predictive statistical models, focusing on Machine Learning algorithms using the scikit-learn library. Strong knowledge of classification models such as KMeans and Naive Bayes, as well as linear regression models.

Azure

Azure data solutions specialist with experience in Data Lake, Data Factory, Databricks, Synapse Analytics, and Power BI integration. Skilled in creating pipelines, processing large volumes of data, and developing interactive dashboards.

Excel

More than 10 years of experience with Excel: pivot tables, dashboards, formulas and functions, connections with other softwares.

EDUCATION AND LANGUAGES

Data Science

Period: 01/2024 to 11/2024

School: IGTI, XPEducação

Civil Engineering

Period: 01/2010 to 12/2016

School: UFTM (University)

Civil Engineering (Exchange)

Period: 08/2015 to 08/2016

School: Budapest University of Technology and Economics

Languages

Portuguese: Native

English: Advanced

AI with Data Science

Period: 01/2025 to present

School: IGTI, XPEducação

DESCRIPTION OF PROFESSIONAL EXPERIENCES

Personal Project 1

▪ SQL Server as my initial database;
▪ Created a pipeline in Azure Data Factory to connect the on-premises database with the cloud Data Lake and to transform data using scripts developed in Databricks;
▪ Developed notebooks in Databricks with all necessary data processing;
▪ Built a data warehouse in Azure Synapse (SQL Serverless Pool);
▪ Automated pipeline updates;
▪ Connected Azure Synapse with Power BI;
▪ Designed a dashboard in Power BI.

Skills: SQL Server, Azure, Data Lake, Data Factory, Databricks, Synapse and Power BI.

Personal Project 2

▪ Project with job offers data, targeting people who are new or are migrating to positions related to data;
▪ All the data went through ETL, creation of dimension tables (using the fact table) and connection of MySQL with Python;
▪ Used MySQL as a database to get a better performance;
▪ Connected MySQL with Power BI and did just a small treatment on Power Query (for performance reasons);
▪ Created semantic model, measures, graphics and tables on Power BI;
▪ Used the visuals to tell the story, which will help people to put efforts in the right direction at the moment to find the first job.

Skills: Python (pandas, sqlalchemy and requests), MySQL, Power BI, Trello, Power Point, Data Storytelling (design).

Polly

▪ Automation of operational processes, accessing client websites (web scraping), and updating tables and grids in the
company’s system using Python. This made the updating processes 50% faster.
▪ Control of answered tickets, evaluating the team's performance through the company's Analytics platform.
▪ Resolving customer support tickets forwarded to the content team, which may include a full audit of existing investors to
ensure content accuracy (eligibility and/or LLPAs).

Skills: Python (selenium, pandas), automation, webscrapping, Excel, american mortgage.

Sicoob Bank

▪ Responsible for creating and compiling daily, weekly, monthly, and quarterly reports and dashboards with bank data,
including revenue, results, active base, prospective base, inactive base, settlement, and outcomes, contributing to a 25%
reduction in report generation time.
▪ Developed simulators to present forecasts, profitability targets, and performance projections in bank performance
programs, improving forecast accuracy by 20%.
▪ Utilized Power BI to ensure seamless data flow, create cloud environments for data storage (Dataflow and Datamart),
automate the base update process—reducing manual work by 30%—manage access control, and develop interactive
dashboards and reports that enhanced stakeholder engagement by 15%.
▪ Wrote SQL SERVER queries to cross-reference data, calculate campaign and bank program metrics, and extract insights
from databases, leading to more data-driven decisions and a 10% increase in campaign effectiveness.

Skills: Python (pandas, numpy, scikit-learn, matplotlib, plotly), Power BI, Excel, SQL Server, finances, team support, predictions, simulations.

Dataclimb – Freelance

▪ Elaboration of reports for a rental services company, presenting: revenue statements, expenses, excess expenses, expense budgets, accounts payable, accounts receivable, profitability, and scenario simulator.
▪ Report for a construction company: data processing and modeling in Excel and Power Query, connection to a database in Google Sheets, and report development in Power BI, containing expected budgets, visualization of budgeted and executed amounts, ABC Curve, Gantt Chart, physical dispersion, and financial dispersion.
▪ Report for a supermarket chain, which includes: data processing and modeling in Excel and Power Query in Power BI, and report development in Power BI. Including: revenue visualizations (target, projected revenue, and variation between revenue projection and target) and expenses.

Skills: Power BI, Excel, client meetings, ETL on Power Query.

National Department of Transportation Infrastructure (Federal Institution)

▪ Creation of BI reports, in POWER BI, with descriptive and analytical statements of federal programs: National Weighing Plan, National Speed Control Plan, and Stopping and Rest Points.
▪ Responsible for the entire Rest and Checkpoints project at DNIT.

Skills: Stopping and Rest Points Project, Excel, Power BI and communication with client.

NAQUINZE Bar and Tattoo Studio

▪ Relationship between revenue (cash and receivables) and payments (scheduled and paid) and period analysis for high-value purchases.
▪ Balanced Performance Indicators: revenue, targets, sales forecast, sales projection, and analysis of the possibility of achieving the monthly target.
▪ Trend analysis: YoY (year over year) and MoM (month over month) comparison of revenue vs. target.

Skills: control of staff, finances, client profile analysis, Power BI, Excel.

©2021 por Felipe Teodoro. Orgulhosamente criado com Wix.com

bottom of page